
Opening, closing or merging a warehouse ties up capital for years. Leases, staff, IT and customer promises all follow the decision. Yet in many mid-sized companies, warehouse location planning still happens in a spreadsheet, from experience, or on the basis of a single quote from a logistics provider.
This guide shows how to decide differently: with a model of your network, a validated baseline and a handful of well-chosen scenarios. The approach works for companies with a few sites as well as for networks with several plants, warehouses and thousands of customers.
Why spreadsheets fall short for site decisions
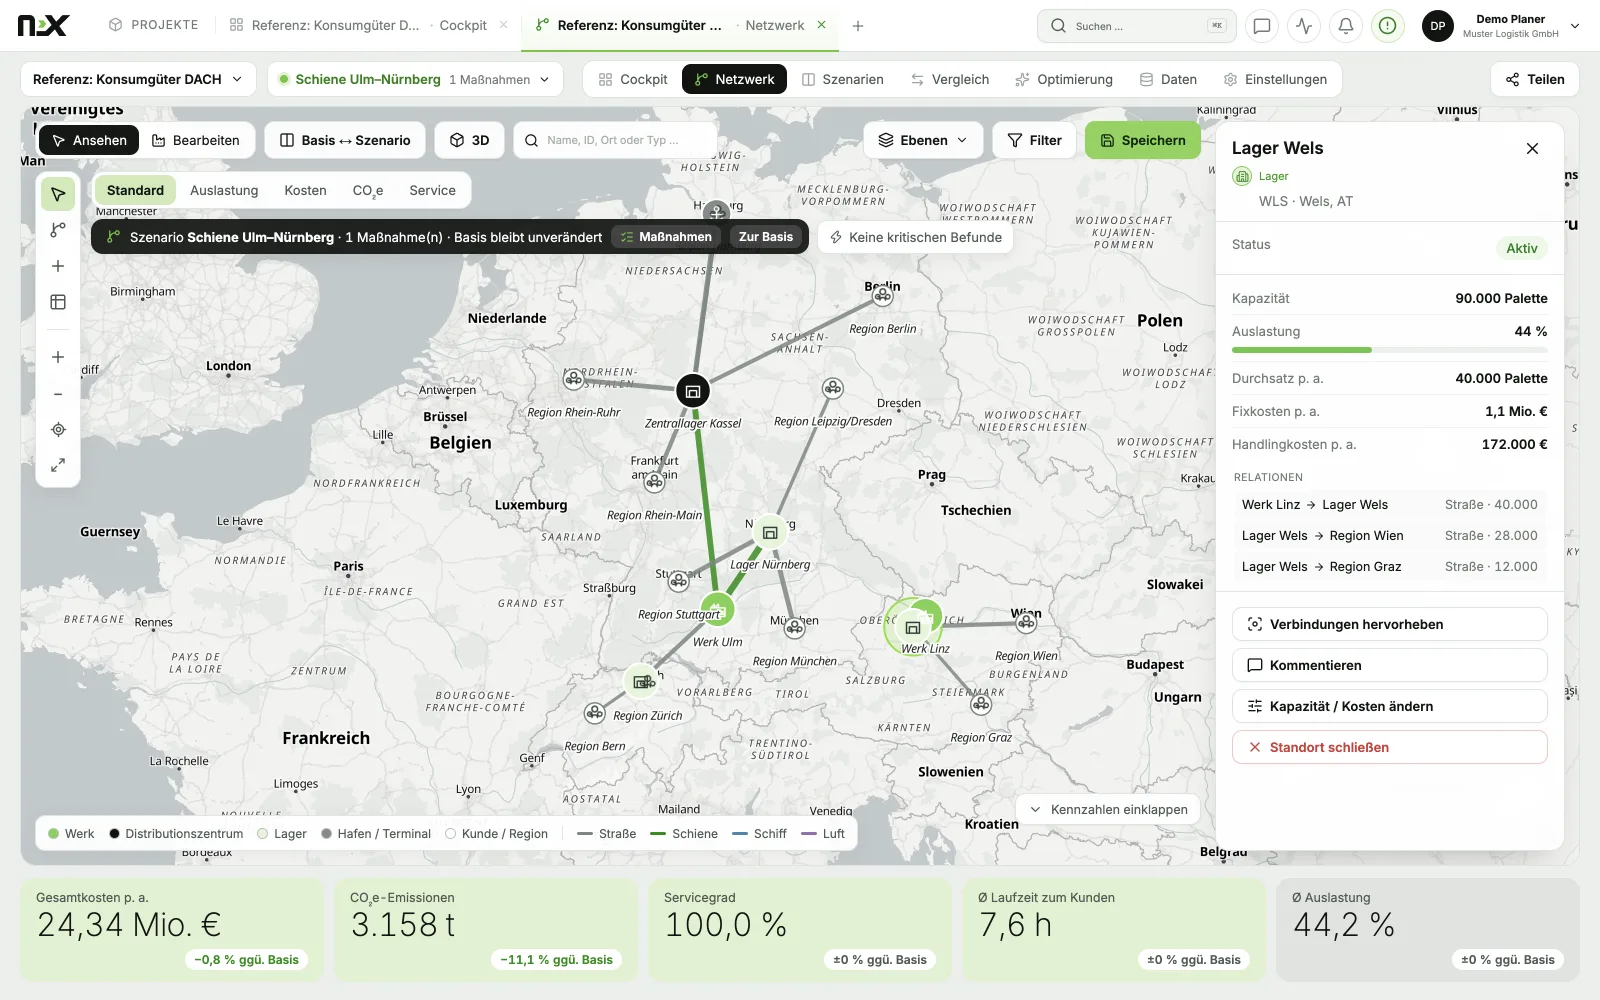
A warehouse never works on its own. Close one site and its volume moves to the others: transport distances change, some warehouses run full, delivery times to certain regions get longer, and the cost of every lane shifts. A spreadsheet can calculate one of these effects at a time. It rarely captures all of them together.
The result is a familiar pattern: the business case looks convincing in the meeting, but nobody can say how robust it is when volumes grow, a customer moves or diesel prices rise. Network planning solves exactly this. It treats sites, lanes, demand and capacity as one connected system and calculates every scenario on the same basis.
The data you actually need
Most companies already hold the data for a first model. It just sits in different places. For a warehouse location study you typically need:
- Sites: plants, warehouses, cross-docks and ports with address, capacity, fixed costs and handling costs.
- Demand: volumes per customer or delivery region over a representative period, ideally twelve months.
- Freight: freight rates or freight invoices per lane and transport mode.
- Service targets: required delivery times or the share of customers you need to reach within a given time.
- Constraints: leases, minimum volumes, sites that must stay open, and customers that must be served from a specific warehouse.
Two practical tips. First, real freight rates are better than flat assumptions: tolls and surcharges are already included, which makes the model more precise than any average cost per kilometre. Second, accept data gaps and document them. Distances can be estimated where no route data exists, as long as every assumption is visible in the project.
Start with a baseline everyone signs off
Before you calculate a single alternative, model today’s network and compare it with your actual figures. If the baseline does not reproduce this year’s transport and warehouse costs within a reasonable range, no scenario built on top of it will be trusted.
The sign-off of the baseline is the most important milestone of the project. Logistics, controlling and management agree that the model reflects reality. From then on, discussions are about decisions, not about whose numbers are right.
Scenarios worth testing
Good scenarios answer the questions management is actually asking. Typical examples:
- Close or merge two warehouses – what happens to cost and delivery times?
- Open a new site closer to a growing region.
- Reassign customers or regions to a different warehouse.
- Shift selected lanes from road to rail.
- Grow volume by 10 % – where do bottlenecks appear first?
Once the obvious scenarios are calculated, an optimiser can search for the best configuration on its own. It decides on sites, assignments, volumes and transport modes – but only within your rules: leases that cannot be ended, minimum utilisation per site, single sourcing for certain customers, or if–then conditions. Rules capture the reality that a pure cost model does not know. The optimised result should then be created as a normal scenario and recalculated, so it can be compared like every other alternative.
Compare more than cost
The cheapest network is not automatically the best. Compare each scenario against the baseline on at least four measures:
- Total cost per year, broken down by cost type – transport, warehouse fixed costs, handling.
- CO₂e emissions of transport, calculated the same way for every scenario.
- Service level: the share of demand delivered within the target time.
- Utilisation of each site, to spot networks that only work on paper.
A cost bridge helps management follow the logic: which cost type changes by how much between baseline and scenario. That makes the result traceable instead of a black box. For a broader view of network modelling, see our guide to supply chain network optimization.
From analysis to a decision paper
The last step is often underestimated. Management needs a decision paper that can be understood without the tool: a map of the recommended network, the key figures against the baseline, the measures required and the assumptions behind them. Up to four alternatives side by side are usually enough; more options make the decision harder, not easier.
A realistic timeline for a mid-sized company is six to eight weeks: one week for kick-off and data, two weeks for the baseline, two to three weeks for scenarios and optimisation, and one to two weeks for comparison and the board presentation. With fixed interim results – especially the signed-off baseline – the project stays predictable for everyone involved.
Frequently asked questions
How long does a warehouse location study take?
For a mid-sized company, a full network study typically takes six to eight weeks. A first check with a baseline model and three scenarios can be done in two to three weeks.
Which data do we need for warehouse location planning?
Sites with costs and capacities, volumes per customer or region, freight rates or invoices, service targets and known constraints such as leases. Missing data can be estimated, as long as the assumptions are documented.
Can we plan warehouse locations in Excel?
Excel works for a single effect, such as the transport cost of one lane. Site decisions change many things at once – volumes, distances, utilisation and delivery times – which is why a network model with scenarios gives more reliable answers.
How is CO₂e calculated in a network study?
Transport emissions are calculated from volumes, distances and transport modes as planning values. What matters most is that the same method is used for the baseline and every scenario, so the differences are comparable.
Related reading
Which warehouses do you really need?
Start with a network check or a full network study – with a decision paper your management can sign.